Mass spectrometry
History of mass spectrometry
- mass spectrometry was developed in a laboratory under the supervision of Hermann von Helmholtz
- Eugene Goldstein, a student of von Helmholtz’s, discovered that when current flows through a perforated cathode, the holes emant a faint but visible radiation
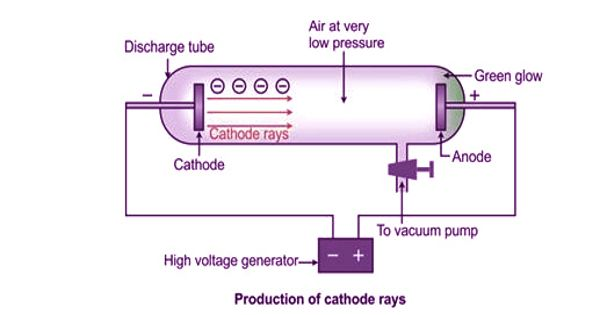
- the observed particles were studied by Wilhelm Wien, another student of von Helmholtz’s
- he constructed a velocity selector (Wien’s filter)
- he was able to move the canal ray and using the curvature, he calculated the exact mass of the particle constituting the canal ray
- the particle was later named proton
Calculating mass using the curvture of the flightpath of a charged particle
- within any point of the path of the charged particle, there exists an equilibrium of electromagnetic force (moving the particle from a straight path) and centrifugal force (reacting to the electromagnetic force)
$$F_{electromagnetic}=F_{centrifugal}$$
- thus:
$$zvB=\cfrac{mv^2}{r}$$
- where
- $z$ is charge
- $v$ is velocity
- $B$ is magnetic field strength (in a vacuum)
- $m$ is mass
- $r$ is radius
- rearraning the formula mentioned above we get:
$$m=\cfrac{zBr}{v}$$
- the mass we get from the above written calculation is the atomic mass of an element
- it is usually denotated as $m/z$
- it has the unit called Dalton (Da)
- relative atomic mass is different from atomic mass, since atomic mass represents the mass of a single isotope
- relative atomic mass does not have a unit
Reading mass spectra
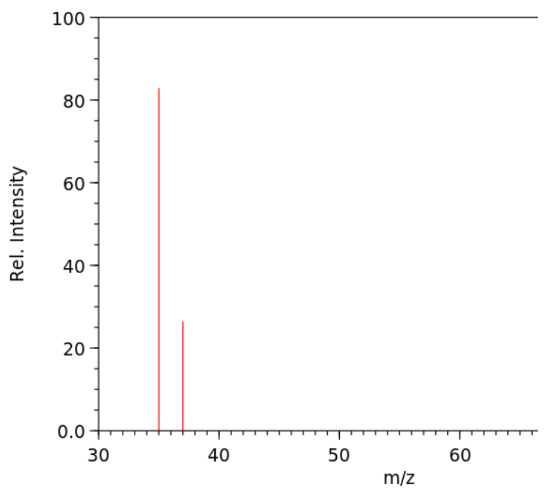
- the results of mass spectrometry meassurements are usually ploted on a graph with the y-axis representing relative intensity and the x-axis representing $m/z$
- if only one isotope of an element is present in a sample, we only see one peak
- if there are multiple isotopes present in the sample, we se multiple peaks
Photoelectron spectroscopy
Photoelectric effect
If a photon of high enough energy hits an electron with binding energy equal or lower to the energy of the photon, the electron is emitted from the atom and is from then called a photoelectron.
- the energy needed to emit an electron is called the work function - $\Phi$
- it represents the binding energy of an electron
- the binding energy of an electron is determined by the energy level it is on
- the work function can be calculated as:
$$\Phi=h\nu_0$$
- where:
- $h$ is the Planck’s constant ($\approx{6.626\cdot{10^{-34}}J\cdot{s}}$)
- $\nu_0$ is the frequency of the electron (behaving both as a particle and as a wave)
- the energy of an photon can be calculated as:
$$E=h\nu$$
- where:
- $\nu$ is the _frequency of the photon (behaving both as a particle and as a wave)
- the kinetic energy of an emitted electron - $E_{k,e}$ can then be calculated as:
$$E_{k,e}=h\nu-\Phi$$
- from this equation, we can also get the work function
$$\Phi=h\nu-E_{k,e}$$
- this equation is commonly rewritten including the wavelength of the photons
$$\Phi=\cfrac{hc}{\lambda}-E_{k,e}$$
- where:
- $c$ is the speed of light ($=299,792,458\ m\cdot{s^{-1}}$)
- $\lambda$ is the wavelength of the photon
Photoelectron spectrometer
- photoelectron spectrometer is a device which can shine a beam of light of a certain frequency on a sample and then detect the kinetic energies of emitted electrons
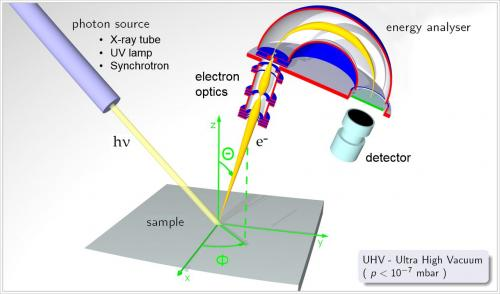
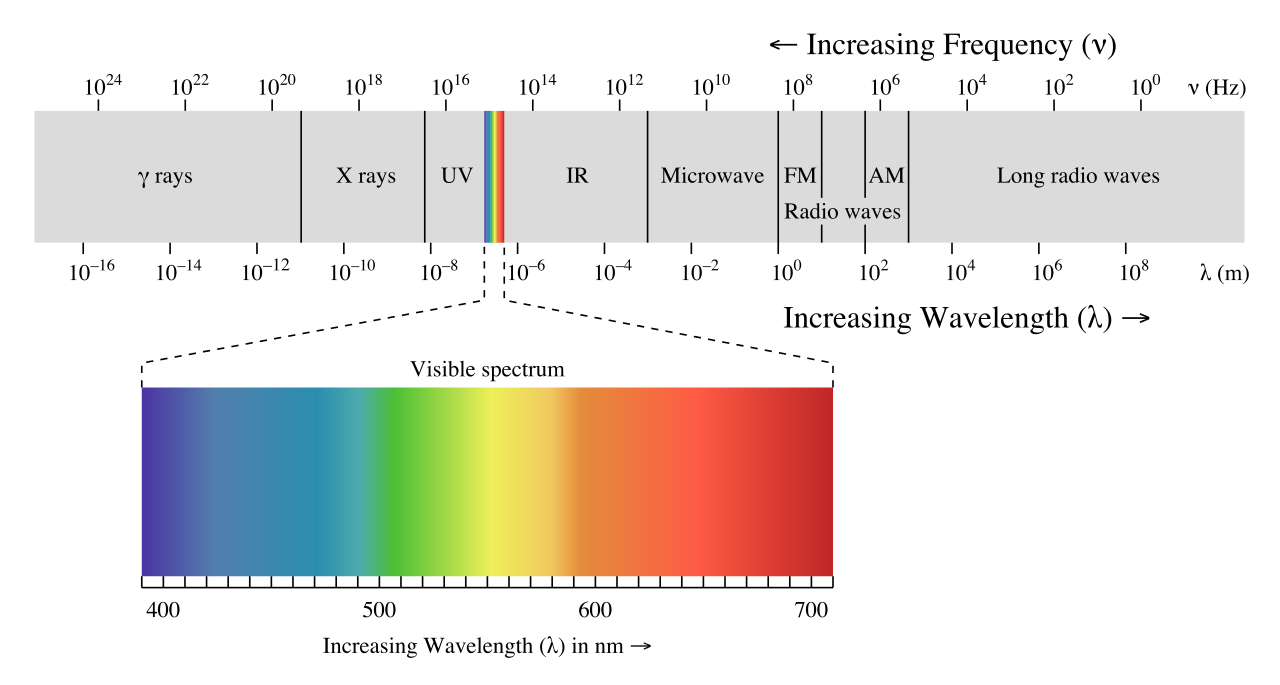
- different photon sources are used depending on the wavelength of photons needed to emit the intermost electrons
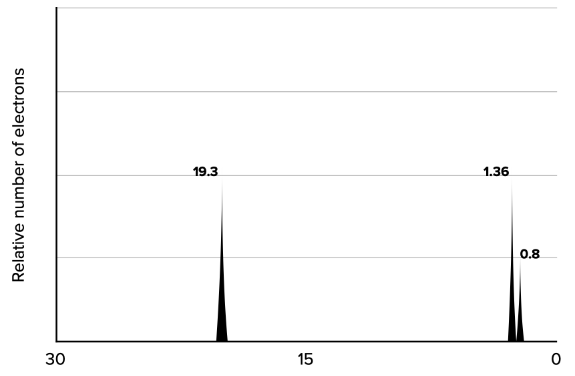
Reading energy spectra
- results of photoelectron spectroscopy are plotted on a graph, where the y-axis represents the relative number of emitted electrons and the x-axis represents the energy needed to emit them (in $MJ\cdot{mol^{-1}}$)
- the intermost electrons will have higher energies needed to emit them (ionization energy)
- the biggest gaps of ionization energies are between electrons on different energy levels of the electron shell
- the wavelength of light needed to emit an electron can be calculated as:
$$\lambda=\cfrac{hc}{\Phi}$$
- the work function needs to first be converted from $MJ\cdot{mol^{-1}}$ to $J$ using $\cfrac{10^6}{N_A}$
- the final formula looks like this:
$$\lambda=\cfrac{hcN_A}{\Phi\cdot{10^6}}$$# Photoelectric effect
If a photon of high enough energy hits an electron with binding energy equal or lower to the energy of the photon, the electron is emitted from the atom and is from then called a photoelectron.
- the energy needed to emit an electron is called the work function - $\Phi$
- it represents the binding energy of an electron
- the binding energy of an electron is determined by the energy level it is on
- the work function can be calculated as:
$$\Phi=h\nu_0$$
- where:
- $h$ is the Planck’s constant ($\approx{6.626\cdot{10^{-34}}J\cdot{s}}$)
- $\nu_0$ is the frequency of the electron (behaving both as a particle and as a wave)
- the energy of an photon can be calculated as:
$$E=h\nu$$
- where:
- $\nu$ is the _frequency of the photon (behaving both as a particle and as a wave)
- the kinetic energy of an emitted electron - $E_{k,e}$ can then be calculated as:
$$E_{k,e}=h\nu-\Phi$$
- from this equation, we can also get the work function
$$\Phi=h\nu-E_{k,e}$$
- this equation is commonly rewritten including the wavelength of the photons
$$\Phi=\cfrac{hc}{\lambda}-E_{k,e}$$
- where:
- $c$ is the speed of light ($=299,792,458\ m\cdot{s^{-1}}$)
- $\lambda$ is the wavelength of the photon
Photoelectron spectrometer
- photoelectron spectrometer is a device which can shine a beam of light of a certain frequency on a sample and then detect the kinetic energies of emitted electrons
- different photon sources are used depending on the wavelength of photons needed to emit the intermost electrons
Reading energy spectra
- results of photoelectron spectroscopy are plotted on a graph, where the y-axis represents the relative number of emitted electrons and the x-axis represents the energy needed to emit them (in $MJ\cdot{mol^{-1}}$)
- the intermost electrons will have higher energies needed to emit them (ionization energy)
- the biggest gaps of ionization energies are between electrons on different energy levels of the electron shell
- the wavelength of light needed to emit an electron can be calculated as:
$$\lambda=\cfrac{hc}{\Phi}$$
- the work function needs to first be converted from $MJ\cdot{mol^{-1}}$ to $J$ using $\cfrac{10^6}{N_A}$
- the final formula looks like this:
$$\lambda=\cfrac{hcN_A}{\Phi\cdot{10^6}}$$